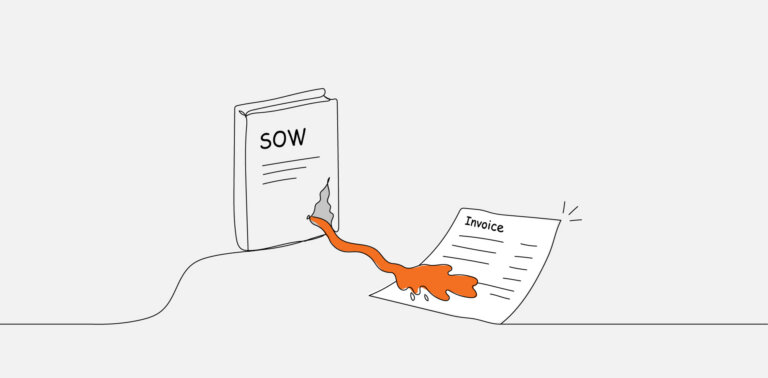
Picture a familiar sequence: a client emails their agency asking if the next dashboard “could have some AI in it.” Three quotes later, it’s a $45,000 build. Six months after that, it’s a failed initiative nobody mentions on QBRs.
Most AI-powered analytics dashboard projects look like this from the inside, and almost none of the failure is the AI’s fault.
The breakdowns sit upstream of the model—data that was never structured for prediction, integrations that needed building rather than connecting, and a client team that wasn’t equipped to act on probabilistic outputs.
The goal is to help agency teams build AI analytics offerings that fit their agency AI roadmap, hold up commercially, and earn renewal, rather than quietly damage trust over nine months.
Predictive Vs Prescriptive Analytics: The Four Layers Explained
An AI-powered analytics dashboard runs predictive or prescriptive models across integrated data sources to forecast outcomes and recommend actions. A standard reporting dashboard visualises historical data from one or a few sources.
Analytics runs in four layers: descriptive, diagnostic, predictive, and prescriptive. Standard reporting sits in the first one or two; AI-powered dashboards work in the last two.
Gartner’s widely referenced Analytic Ascendancy Model splits analytics into four progressive layers: descriptive tells you what happened, diagnostic explains why, predictive forecasts what’s likely next, and prescriptive recommends what to do about it.
Most products being marketed today as “AI-powered” actually sit somewhere between diagnostic and lightly predictive. Genuine prescriptive analytics, the kind that tells a client which channel to cut spend from on Tuesday morning, is rare, expensive, and rarely delivered well.
The first honest scoping conversation in any AI analytics engagement is naming which layer the agency can actually deliver, and confirming that’s what the client needs. An AI readiness audit is the quickest way to get that answer before anything is quoted.
The table below summarises where the two services part ways.
| Standard Reporting | AI-Powered Analytics Dashboard | |
|---|---|---|
| Question Answered | What happened | What’s likely next, and what to do about it |
| Analytics Layer | Descriptive, sometimes diagnostic | Predictive, occasionally prescriptive |
| Data Tolerance | Forgives inconsistent tagging and naming | Breaks on inconsistent or thin data |
| Historical Data Needed | Whatever exists | 12–24 months, clean and consistently structured |
| Data Sources | One or two, loosely joined | Many, integrated and entity-resolved |
| Client Readiness | Someone reads the report | Named owner, agreed KPIs, review rhythm, tolerance for probabilistic outputs |
| Pricing Model | Flat monthly retainer | Phased engagement with separate scopes and go/no-go gates |
Data Quality Is The Hidden Cost
Standard reporting forgives a lot. If UTM tagging is inconsistent across a few campaigns, or a handful of GA4 configuration mistakes skew the numbers, the dashboard still renders something readable; if three naming conventions creep in for the same product, the chart shows three lines, someone on the agency side reconciles it, and the client rarely notices.
AI is far less forgiving. Predictive and prescriptive models need clean, consistently structured, sufficiently large datasets to produce outputs that aren’t confidently wrong, and most client data infrastructures aren’t built to that standard.
A model-ready dataset typically means:
- Consistent naming conventions across campaigns, channels, and platforms.
- Resolved entity matching so the same customer is recognised across CRM, billing, and analytics.
- Timezone and currency normalisation across regions and tools.
- Twelve to twenty-four months of clean historical data.
- Documented business rules for what counts as a “qualified lead” or “active customer.”
McKinsey’s “The State of AI in Early 2024” survey puts a number on how common the problem is, even among the organisations already getting the most value from AI.
For most mid-market clients agencies work with, the same problem tends to hit harder, with far less engineering capacity to absorb it.
The practical implication is that every AI dashboard build starts with a two-to-four-week Data Foundation Audit, plus whatever cleanup it surfaces. Agencies that don’t price this into the engagement either absorb the cost as margin loss or skip it and ship outputs nobody can trust.
Integration Depth Decides What’s Possible
Standard reports often run on a single data source. GA4 connected to Looker Studio, Meta Ads piped into a sheet, a CRM export emailed quarterly—one feed, one view, one set of charts.
AI-powered analytics needs many sources joined together, because a forecast worth acting on depends on seeing how variables move against each other across systems.
Forecasting something useful for a client, such as CAC drift on a paid channel, typically requires:
- Ad spend across Meta, Google Ads, LinkedIn, and any other active platforms
- On-site behaviour and conversion data from GA4 or its equivalent
- CRM pipeline data from HubSpot, Salesforce, Pipedrive, or whatever the client uses
- Revenue and retention data from billing or subscription platforms
- Support ticket volume, in some cases, because it can be a leading indicator of churn
Not every client’s stack is genuinely connectable. Some run legacy CRMs without modern APIs, which turns legacy system integration into a project of its own; some keep their most important numbers in spreadsheets that one person updates manually every Friday.
Discovery has to surface all of this before the engagement is scoped, not during week three of implementation. The integration findings from the Data Foundation Audit largely decide whether the project lands on budget or quietly doubles in cost.
Why Most Clients Aren’t Ready For AI-Powered Analytics Dashboards
Client readiness for an AI-powered analytics dashboard comes down to four things: a named owner with the authority to act on what the dashboard shows, agreed KPIs the model forecasts against, a set rhythm for reviewing outputs, and tolerance for probabilistic results.
Without all four, even an accurate model produces forecasts nobody acts on. Client readiness is the part agencies most consistently underestimate.
If a client struggles to act on “CAC is up 18%,” they almost certainly won’t act on “CAC is forecast to rise 24% by Q3 unless paid spend is reallocated to LinkedIn.”
What Client Readiness Actually Looks Like
Before scoping the engagement, check for:
- A named client-side owner who reviews the dashboard regularly and can act on it
- Agreed KPIs for the model to forecast against, and what counts as a meaningful change
- A set review rhythm, whether weekly standups, monthly leadership reviews, or quarterly planning
- Tolerance for probabilistic outputs, because AI gives confidence intervals rather than certainties, and some clients freeze at “70% likely.”
Better data doesn’t automatically produce better decisions; interpretation, judgment, and the rituals around reviewing it matter as much as the model output, which is why client reporting that gets acted on is a discipline in its own right.
For agencies, that means client education has to be scoped into the engagement rather than added on at handover. If the client team won’t engage with the dashboard, the engagement shipped no value, whatever was built.
Scoping AI Analytics As A Phased Engagement
AI analytics works best scoped as four phases: a Data Foundation Audit, a descriptive and diagnostic dashboard, a predictive layer, and prescriptive recommendations with adoption support.
Each phase is priced separately and ends at a go/no-go gate, so the agency or the client can exit before the predictive layer if the data or client readiness can’t support it.
The most common mistake agencies make with AI analytics is selling it as a feature with a fixed deliverable date.
The smarter approach is to scope it as a capability buildout in clearly defined phases, with go/no-go gates between each one, so both sides can opt out if the foundation isn’t ready. Defining project scope this way front-loads the unknowns instead of discovering them mid-build.
| Phase And Duration | Deliverable | Go/No-Go Question |
|---|---|---|
| 1. Data Foundation Audit (2–4 weeks) | Source map, integration gaps, documented business rules, data quality assessment | Can the data support the analytics layer being sold? |
| 2. Descriptive and Diagnostic Dashboard (4–6 weeks) | Unified dashboard answering what happened and why | Is the client actually using it? |
| 3. Predictive Layer (6–10 weeks) | Forecasts for one to three decision-driving metrics | Are the forecasts changing decisions? |
| 4. Prescriptive Recommendations and Adoption (ongoing) | Recommended actions, training, review cadence | Has analytics become a retention lever? |
Phase 1: Data Foundation Audit
Two to four weeks. The audit stress-tests data quality against what a predictive layer needs, and routinely surfaces deal-breakers that would otherwise have killed the engagement six months in.
Phase 2: Descriptive And Diagnostic Dashboard
Four to six weeks. The unified dashboard alone often beats what the client had before, and it gives the client a working tool while the predictive layer is built.
Phase 3: Predictive Layer
Six to ten weeks. Limit forecasting to the one to three metrics that drive the client’s decisions, because three forecasts done well beat twelve done badly.
Phase 4: Prescriptive Recommendations And Adoption
Ongoing. Most agencies never reach this phase, but those that do see analytics turn from a one-time deliverable into a retention lever.
Phasing the work protects margin, sets honest expectations, and gives the agency clean billable boundaries instead of a fixed-price contract that quietly bleeds for nine months.
What Agencies Selling AI Analytics Should Change
Treating AI-powered analytics dashboards as a Looker Studio upgrade is the fastest way to torch both margin and client trust on the same engagement.
The agencies winning in this space have largely stopped pitching AI analytics as a feature and started scoping it as a capability buildout.
They name the analytics layer they’re actually delivering, price the Data Foundation Audit separately, and treat client education as a deliverable in its own right.
The real measure of whether an AI analytics engagement worked isn’t whether the model produces accurate forecasts—it’s whether the client is making different operational decisions because of what the dashboard tells them.
That’s the lens worth using when planning the scoping, data prep, integration, and adoption work from the start.
Frequently Asked Questions
FAQs
Is A Dashboard With A Chatbot An AI Dashboard?
A chatbot layered onto a standard dashboard is still descriptive analytics with a friendlier query interface. The underlying data and models haven’t changed.
A genuinely AI-powered dashboard runs predictive or prescriptive models against integrated data and surfaces insights that aren’t visible in any single source view. If the answers are limited to what already happened, it’s descriptive analytics with a friendlier interface, not a forecasting layer.
Can AI Analytics Work With Under Twelve Months Of Data?
Sometimes, but the scope has to shrink to match. With less than a year of history, a model can’t see a full seasonal cycle, so forecasts on seasonal metrics won’t hold up.
The practical move is to build the descriptive and diagnostic dashboard first, keep collecting clean data, and add the predictive layer once enough history exists. Short-horizon forecasts on stable, high-volume metrics can sometimes start sooner.
What Happens When A Connected Data Source Changes Its API?
The pipeline can break, or keep running with fields that have quietly changed meaning, so the model forecasts from mismatched inputs.
Scope pipeline monitoring into the retainer, with schema-change alerts that catch broken feeds before they reach a client-facing forecast.